The Kenneth Rainin Foundation aims to make meaningful progress towards a more just and equitable future. Along our journey, we are embracing the opportunities and challenges of centering equity in how we think, make decisions, interact with each other and our stakeholders, and carry out our grantmaking. Data is one way we can ensure we are infusing every aspect of our work—as a funder, partner and employer—with a commitment to equity.
This year we started benchmarking demographic data of our staff and grantees. The work began in January, when our Arts program announced the pilot of an optional demographic survey in their application process to better understand who our grants serve and uncover where we have unintentional biases, barriers or gaps in our support. As we continue to collect demographic information from our grantees we also want to share our own data. Within this blog, you will see the results of our staff demographic survey.
Below are highlights from a conversation with Laverne Matías, Director, Employee Experience and Culture; Lorena Gomez-Barris, Director, Administration; and Jen Rainin, CEO. They talked about the approach to this survey process and how we are using the findings to inform our work. These three leaders oversee our internal Employee Experience Advisory Group, which focuses on deepening our existing culture work to:
- center racial equity and intersectionality as core to our values,
- include voices from across the organization, and
- enable all staff to bring our whole, most authentic selves to work every day.
“Part of creating the best possible team is putting together a richly diverse group of people who represent many different ways of moving through and experiencing the world.”
Jen Rainin, CEO
Understanding Our Own Demographics
At the outset we knew that conducting demographic surveys can raise a variety of concerns, including privacy and how the data would be used. We appreciated talking with our peers who shared their approaches and what they learned from their own data surveys. Conversations with individual staff allowed us to address concerns to achieve a high participation rate.
As with our Arts grantee survey, we scrutinized choices about what data to collect. We made the survey optional and confidential. Ultimately, we collected information on four categories—age, gender, race/ethnicity, and sexual orientation. Our decisions were rooted in capturing what we felt was most applicable to our work today, while minimizing response burden. As such, there are demographic measures that we did not gather. We also recognize that demographic categories are complex and challenging to define, as the ways communities self-identify are continuously intersecting and evolving.
“We want to align with our values to represent and reflect the communities we’re serving. Only then can we engage with and serve our communities effectively.”
Lorena Gomez-Barris, Director, Administration
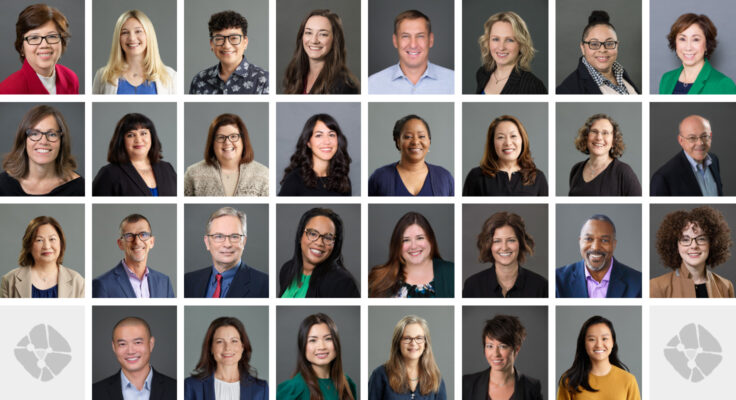
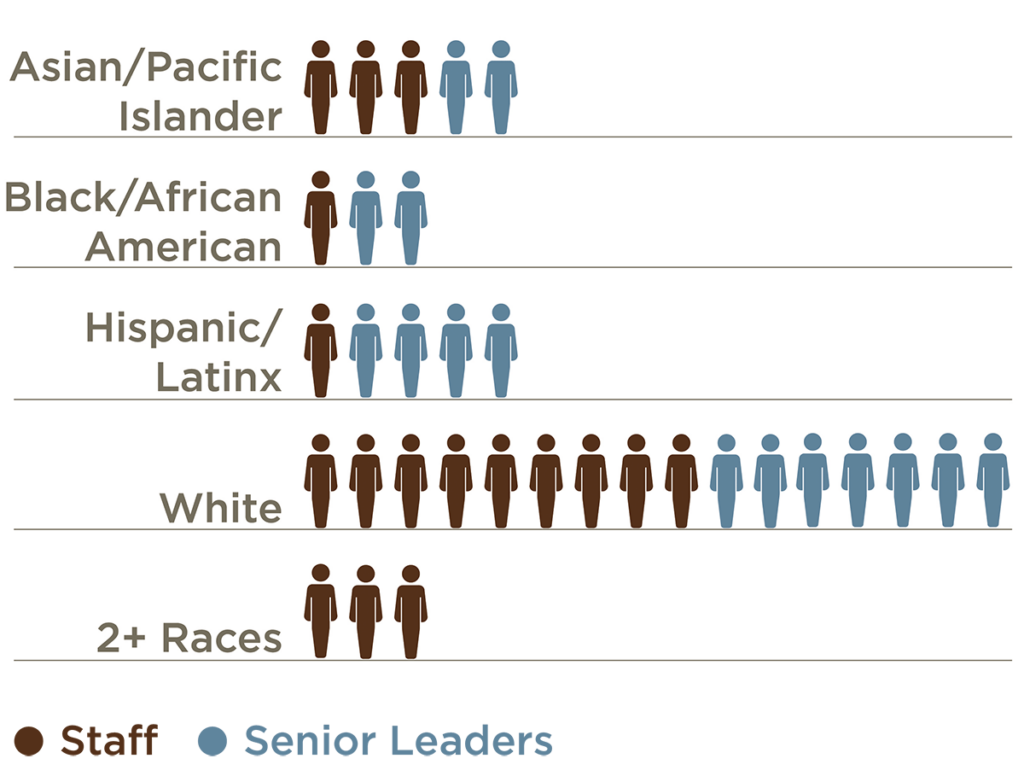
The demographic data provide a snapshot of our staff members. Notably, half of all staff are non-white, with similar diversity among senior leadership. Staff makeup in other categories contributes to the spectrum of experiences and perspectives that enrich our operations and impact. We believe that the people who make up the Rainin Foundation should reflect the richly diverse communities we serve, and continue to work towards that goal.
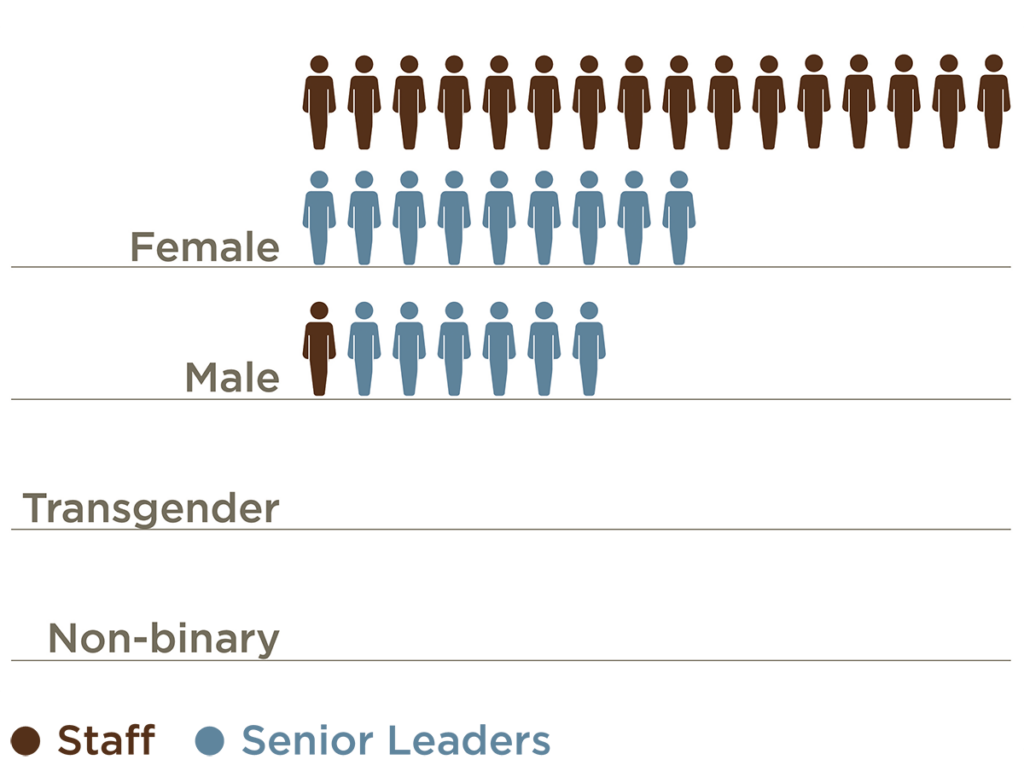
Gender Identity
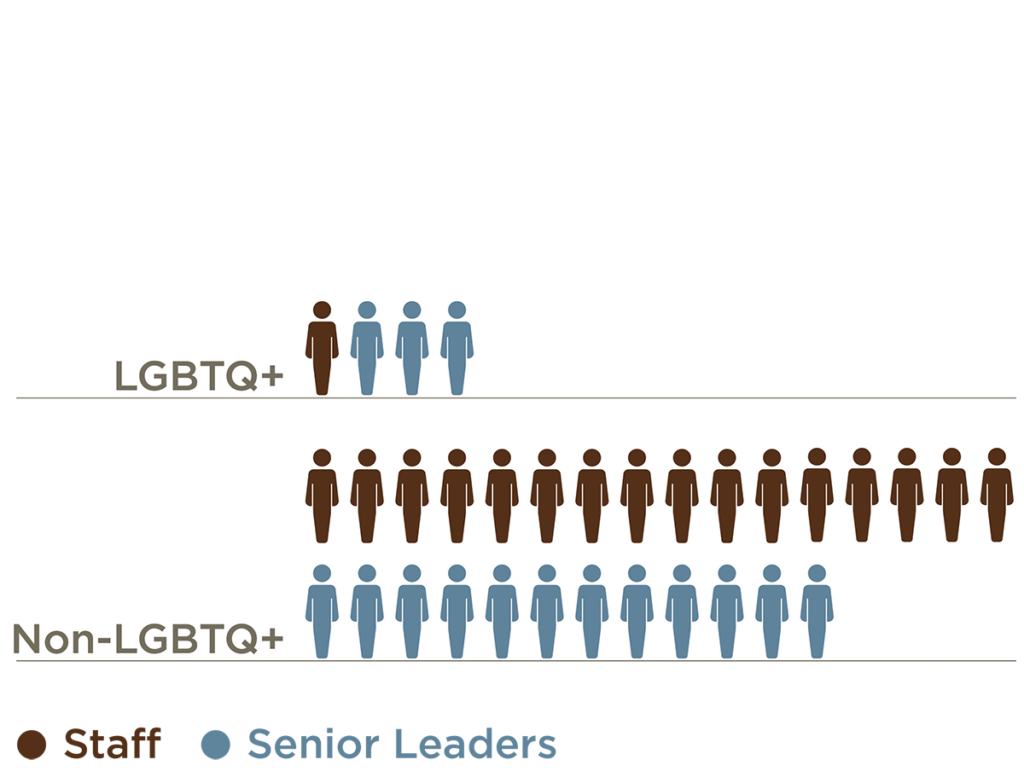
Sexual Orientation
Race / Ethnicity
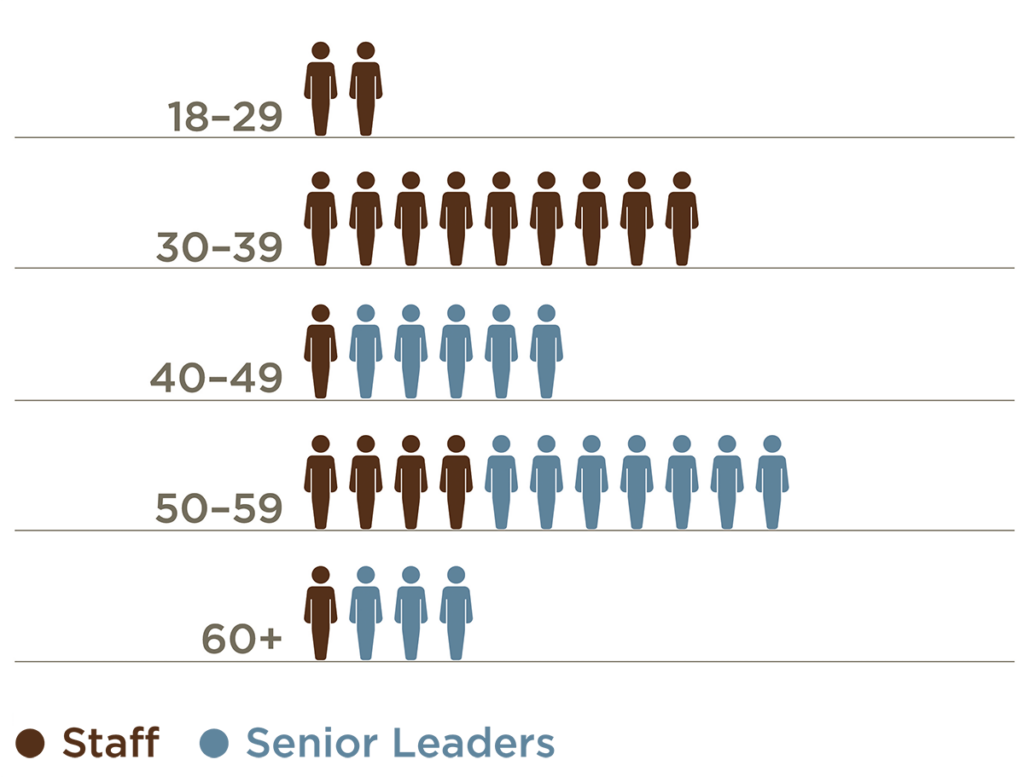
Age
Empowering Staff
As an evolving organization, we know our work benefits from the unique viewpoints of staff. This aligns with our values and celebrates our inherent differences. We strive to cultivate a welcoming and inclusive workplace by creating ways for staff to strengthen relationships at gatherings like our staff-led book club, which centers diversity, equity and inclusion themes. Our first selection was Ta-Nehisi Coates’ Between the World and Me. We also deepen our understanding and appreciation for one another by celebrating cultural events such as Black History and Women’s History months, and contributing to an annual gratitude wall. Our Employee Experience Advisory Group, which is open to all staff members, gives staff the opportunity to participate in advancing diversity, equity and inclusion initiatives and setting priorities. We also aim to empower our staff to do their best work and build their skills. We support professional development opportunities and trainings, one-on-one and group coaching, and encourage staff to participate in conferences and webinars that reflect their professional interests.
“I think that people always look for a place where they can bring their full selves to work and be appreciated for their experiences and what they offer, both professionally and personally.”
Laverne Matías, Director, Employee Experience and Culture
The staff data offer insights into ways we can better support both individuals and teams. Our decision-making and communication strategies are tailored to ensure staff members feel seen and considered. For example, we often think about how we communicate based on generational differences, as well as learning styles. In addition, when it comes to benefits and policies, we ensure that everyone has equitable access to participate and offer suggestions.
Another consideration raised by the data is the experience of only-ness. This feeling—being the only person in the room of a specific identity (e.g., ethnicity, gender or sexual orientation)—can be heightened when identities intersect, as is the case with queer women of color for example. It’s important for organizations to acknowledge that only-ness exists, and even more meaningful when recruitment practices lead to more diverse hires. As leaders, we see how our work and teams are strengthened when we create space and time to welcome and consider different perspectives. Having this demographic information enables us to focus in a more intentional way on the diverse makeup of our organization. And as we advance our diversity, equity and inclusion work, we can leverage the array of experiences among our staff to generate new ideas, solve problems and learn together.
“We hope that sharing this information with our stakeholders builds trust in our authenticity. By sharing how we are living our values internally, it can strengthen understanding of us as an organization and help deepen our connections with the communities we serve.”
Jen Rainin, CEO
Making Good Use Of What We Learn
We expect to collect and report our staff demographic data on an annual basis. As with most of what we do, we approach this work with curiosity and a growth mindset, seeking first to understand. As a learning organization, we will identify the ways we can use this data to achieve our mission. Continued feedback and insights from our staff members will play an important role in that process.
We continue to hold ourselves accountable to these commitments and to being transparent about our journey and what we learn along the way. We look forward to keeping you updated and welcome your questions and insights. Please share your thoughts with us in the comments below or through our contact us form.